Auto Analysis
Auto Analysis manages the full test execution and reporting cycle within Perf Agent. Upload your JMX script to BlazeMeter, trigger test runs through a connected GitHub or Azure DevOps pipeline, monitor results inside Perf Agent, and automatically send result reports to stakeholders by email — all from one place.
Prerequisites
Before using Auto Analysis, ensure the following are in place:
| Requirement | Details |
|---|---|
| Perf Agent access | You must be logged in with a valid account |
| Application configured | Your application must be added via Settings → Applications |
| GitHub integration | Configure GitHub with a Personal Access Token (PAT) under Settings → Integrations before configuring any application |
| BlazeMeter integration | BlazeMeter must be connected under Settings → Integrations |
| JMX script | Either a script generated via Auto Script, or a local .jmx file ready to upload |
Step 1 — Add and Configure an Application
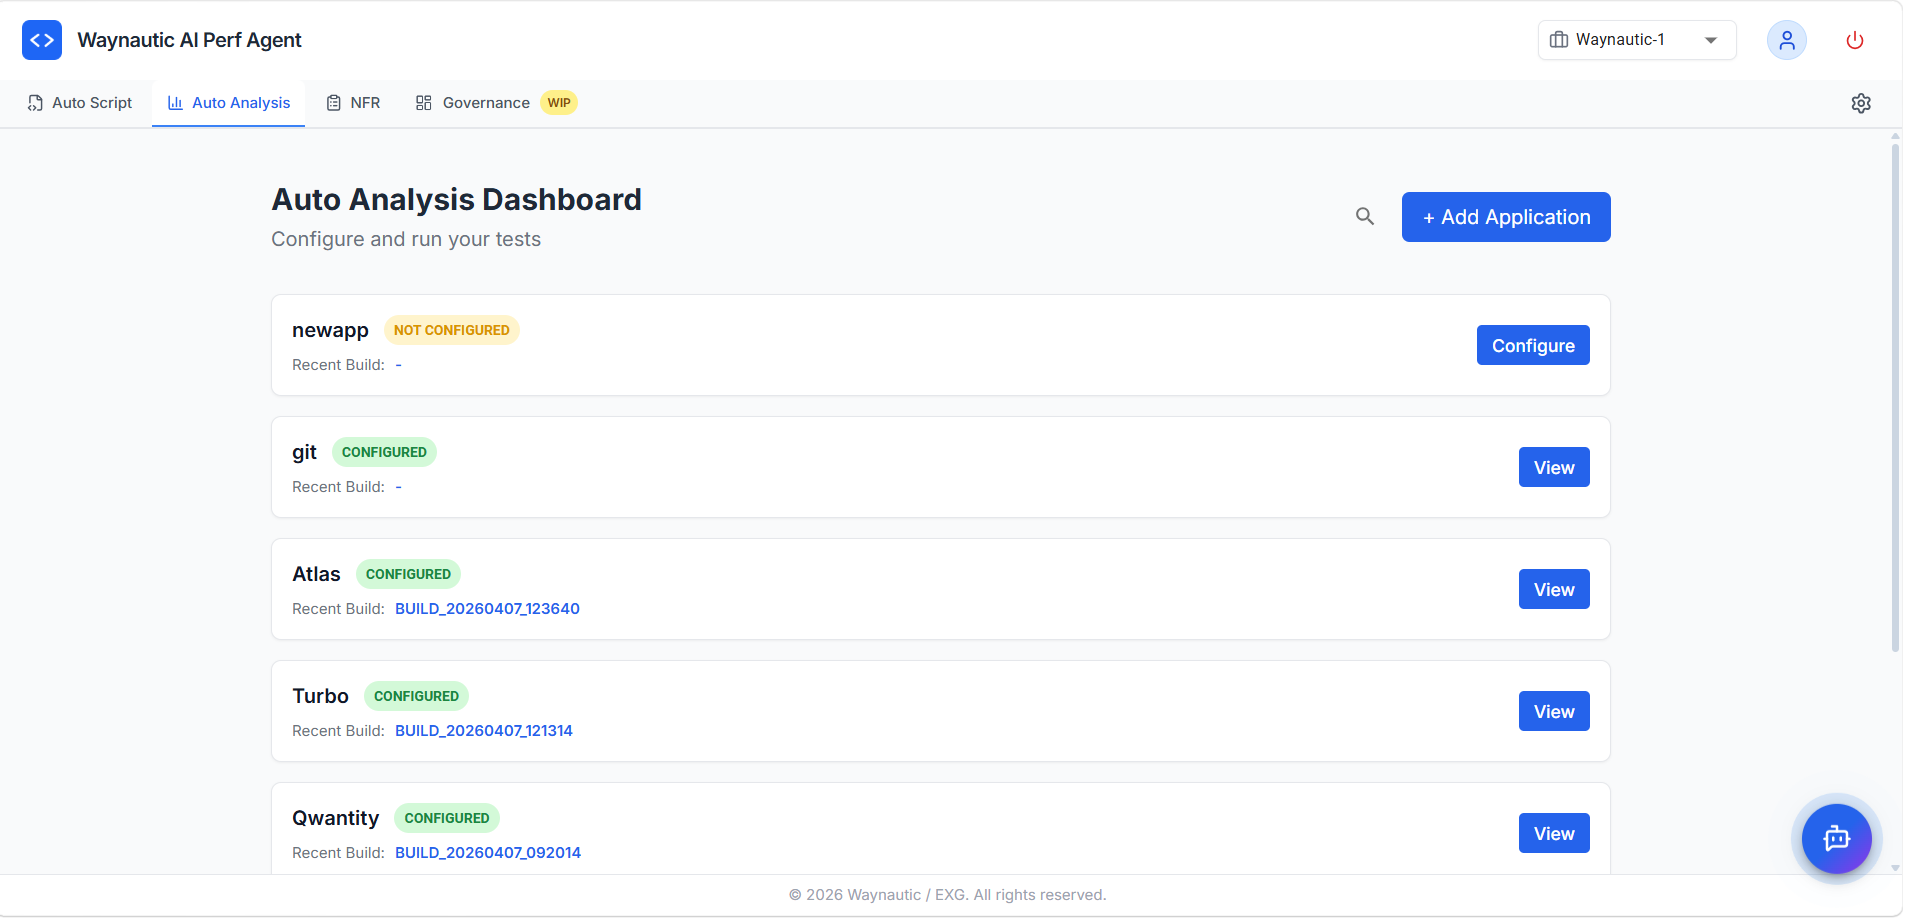
Applications appear in the Auto Analysis Dashboard once they have been added via Settings → Applications. Each application card shows its configuration status and most recent build.
Configuration Statuses
| Status | Meaning |
|---|---|
| NOT CONFIGURED | The application has been added but not yet configured for Auto Analysis |
| CONFIGURED | The application is fully set up — script, GitHub workflow, and BlazeMeter are all in place |
| PARTIALLY CONFIGURED | A previously configured resource (GitHub workflow or BlazeMeter test) has been deleted externally. Reconfigure the application to restore full functionality |
Click Configure next to any unconfigured application to open the configuration panel.
Step 2 — Configure the Application
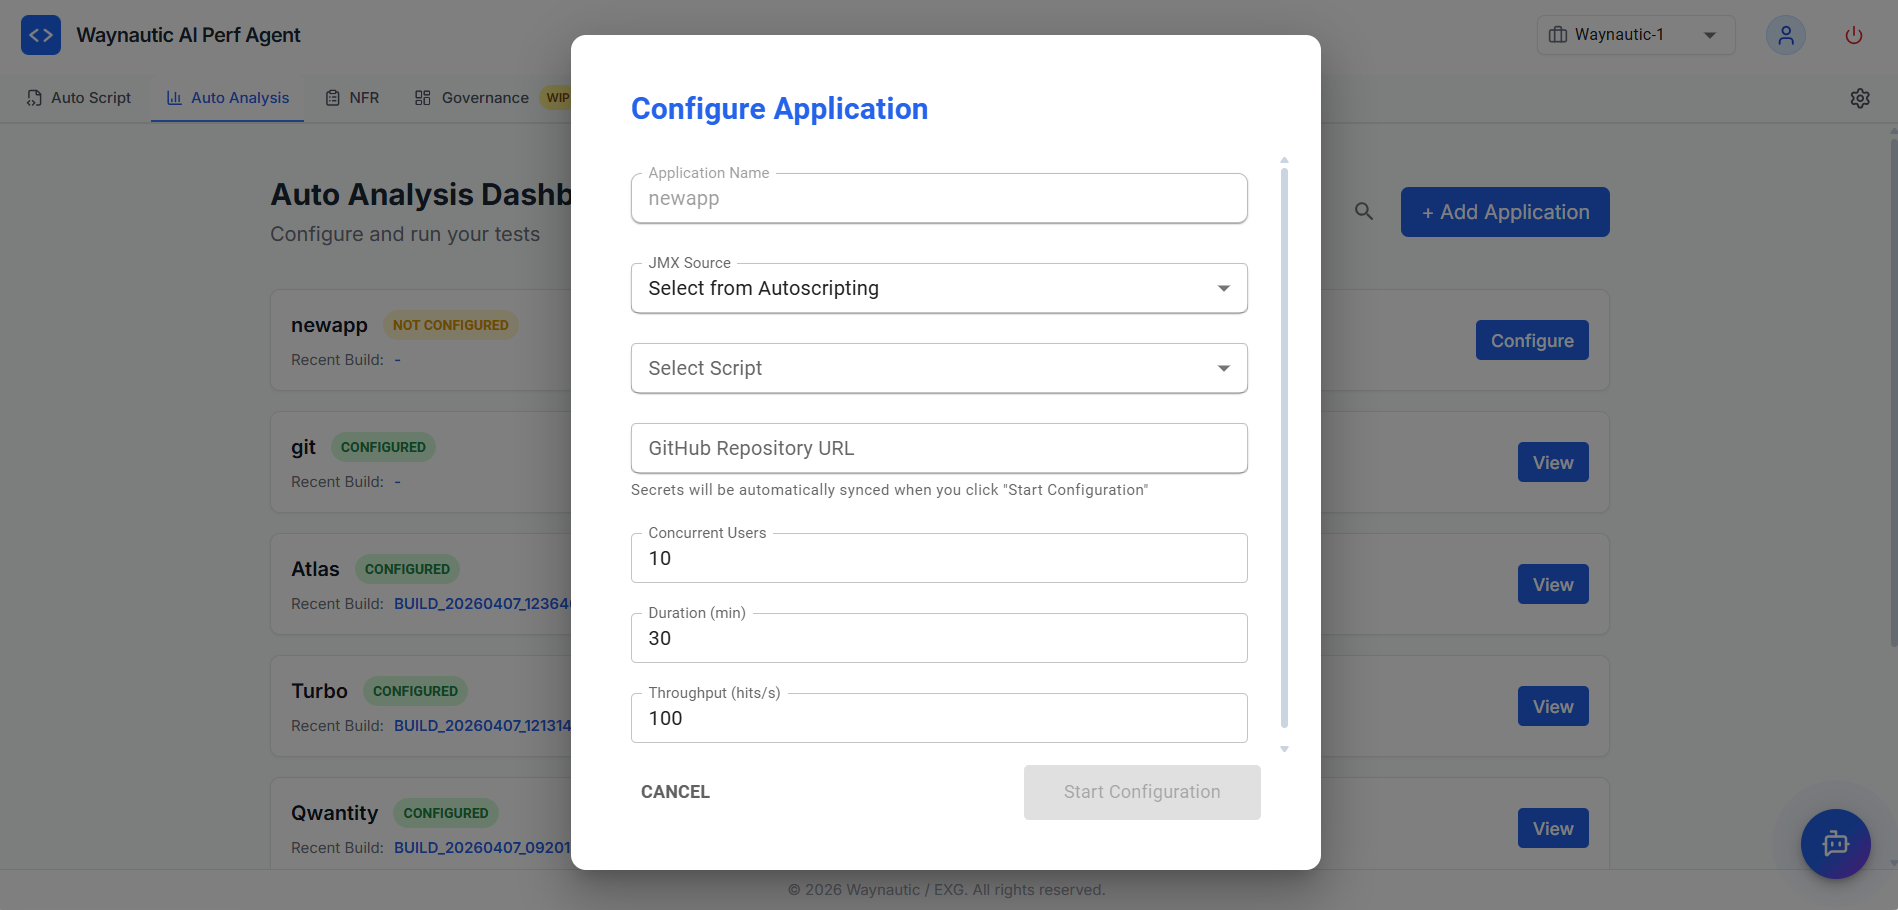
The Configure Application panel collects the details Auto Analysis needs to set up your test in BlazeMeter and create a GitHub Actions workflow in your repository.
Fields
| Field | Description |
|---|---|
| Application Name | Pre-filled with the application name from Settings — read-only |
| JMX Source | Where the script comes from — select Select from AutoScripting if the JMX was generated by Auto Script for this application, or Upload from Local to upload a .jmx file from your machine |
| Select Script (AutoScripting only) | Dropdown of completed scripts generated under this application in Auto Script |
| GitHub Repository URL | The URL of the GitHub repository where the Actions workflow will be created |
| Concurrent Users | Number of simultaneous virtual users for the test run (default: 10) |
| Duration (min) | How long the test should run in minutes (default: 30) |
| Throughput (hits/s) | Maximum requests per second for the test (default: 100) |
How to Configure
- Select your JMX Source and either choose a script from the dropdown or upload a local
.jmxfile - Paste your GitHub Repository URL
- Adjust Concurrent Users, Duration, and Throughput to match your target load
- Click Start Configuration
When you click Start Configuration, Auto Analysis automatically:
- Uploads the JMX script to your connected BlazeMeter account
- Creates a GitHub Actions workflow file in the specified repository
- Syncs the required secrets to the repository
Your GitHub integration must be configured with a valid PAT token under Settings → Integrations before clicking Start Configuration. Without this, the workflow cannot be created in your repository.
Once configuration completes, the application status updates to CONFIGURED on the dashboard.
Step 3 — View Application Details
Click View on any configured application to open its detail page. The View screen has four collapsible sections.
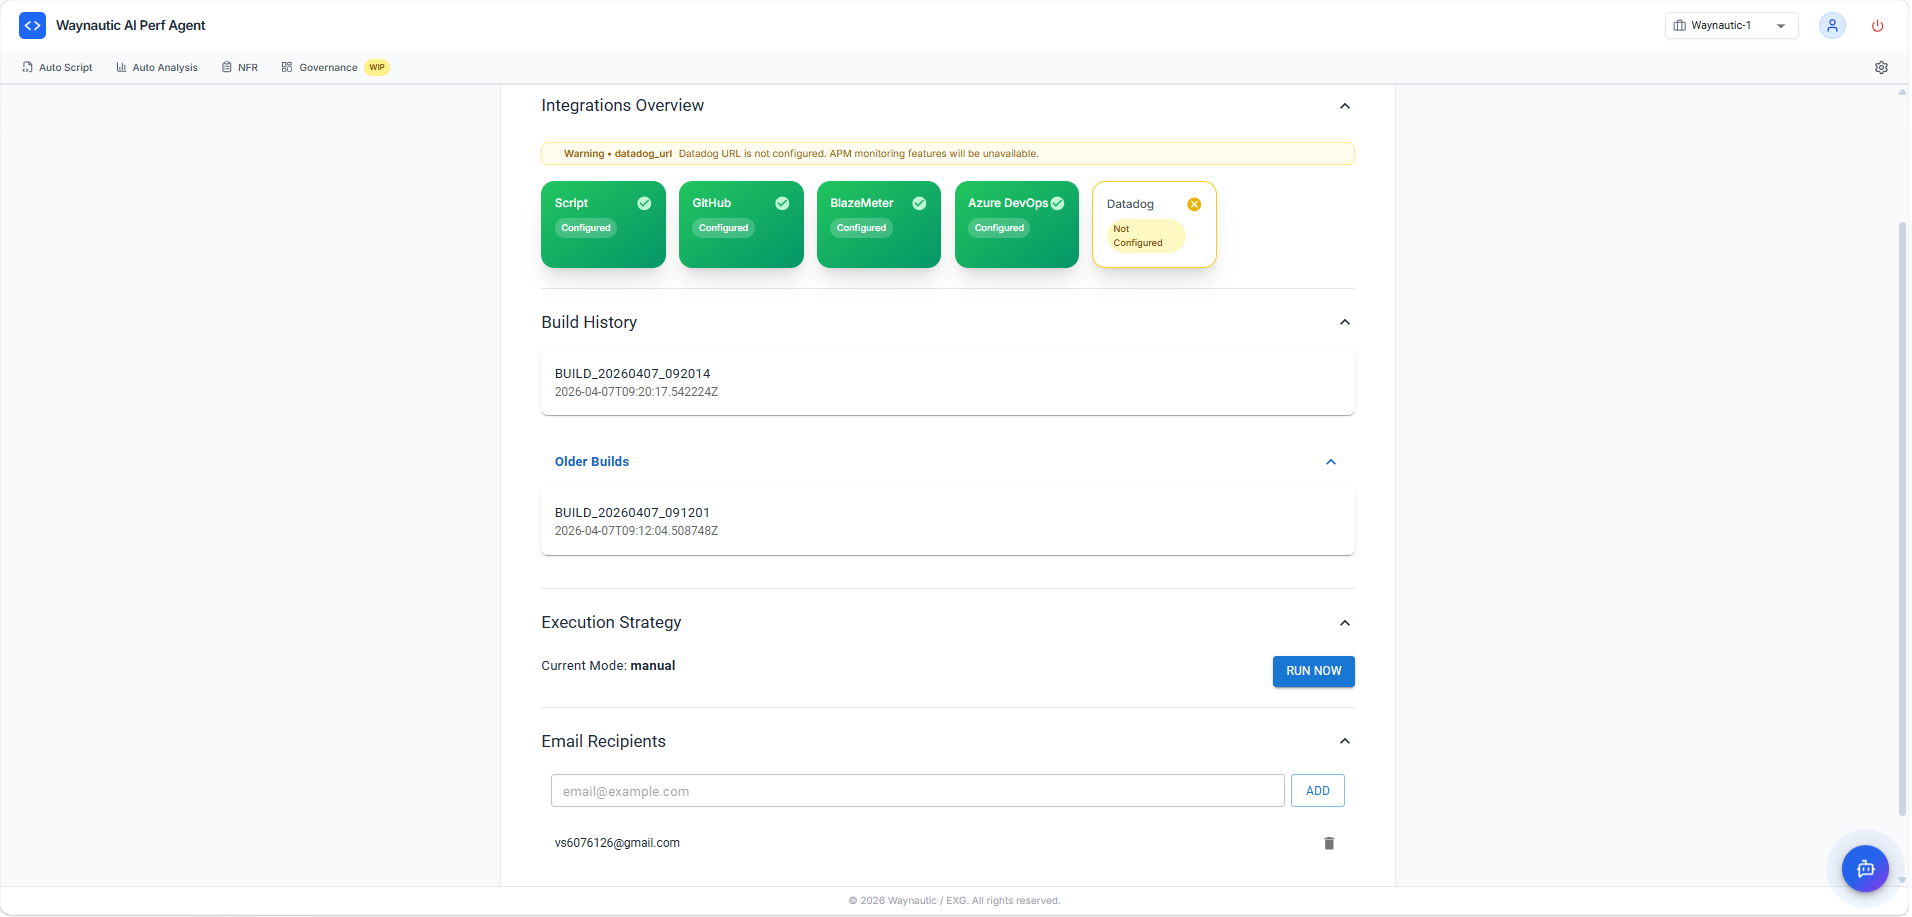
Integrations Overview
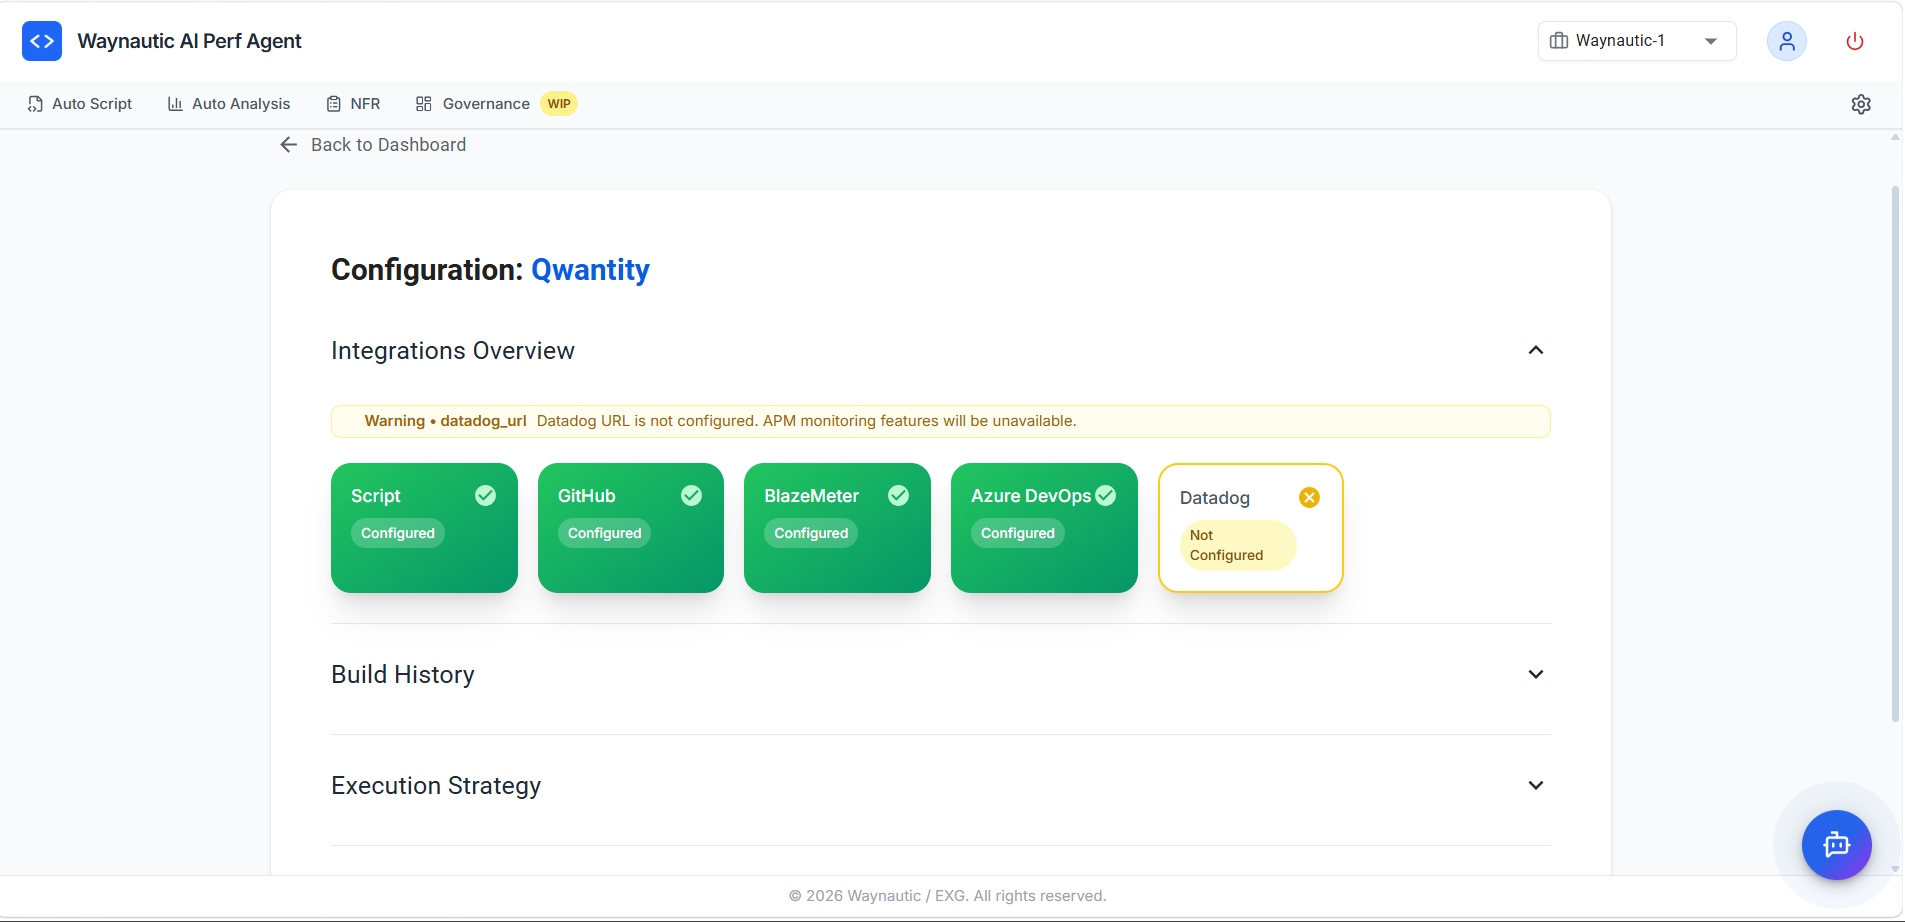
The Integrations Overview section shows the connection status of each integration for this application:
| Integration | Status Meaning |
|---|---|
| Script | The JMX file has been uploaded to BlazeMeter |
| GitHub | The Actions workflow has been created in the configured repository |
| BlazeMeter | The test plan is set up in your BlazeMeter account |
| Azure DevOps | Connected if configured under Settings → Integrations |
| Datadog | Connected if a Datadog URL is configured — required for APM monitoring data in build reports. If not configured, a warning banner is displayed and APM data will be unavailable |
If you delete the GitHub workflow or BlazeMeter test plan externally (outside of Perf Agent), the corresponding tile will show Not Configured and the application status will change to PARTIALLY CONFIGURED. Re-run the configuration to restore it.
Build History
The Build History section lists all test runs triggered for this application.
Each entry shows:
- Build ID — a unique identifier in the format
BUILD_YYYYMMDD_HHMMSS - Timestamp — when the build was triggered
The section is split into the most recent build and an Older Builds expandable list for previous runs.
Click any build entry to open the build report. See Viewing Build Results below.
Execution Strategy
The Execution Strategy section displays the current execution mode and provides the option to trigger a test run manually.
Current Mode shows how the test is triggered — typically manual.
Click RUN NOW to be redirected to the GitHub Actions page for your repository, where you can click Run workflow to start the test. GitHub then triggers the BlazeMeter test run, monitors execution, and sends result emails to all configured recipients upon completion.
The RUN NOW button is disabled if the GitHub integration has been removed or is not configured under Settings → Integrations. Reconfigure the GitHub integration before attempting to trigger a run.
Add all email recipients (see Email Recipients below) before clicking RUN NOW or triggering the GitHub workflow. Recipients added after a run has started will not receive the report for that build.
Email Recipients
The Email Recipients section manages who receives automated test result reports after each run.
To add a recipient:
- Enter an email address in the input field
- Click ADD
- The address appears in the list below
To remove a recipient, click the delete icon (🗑️) next to their email address.
There is no limit on the number of recipients. Add all relevant stakeholders — team leads, project managers, or clients — who need visibility into test results.
Viewing Build Results
Click any build entry in Build History to open the full build report.
Report Sections
| Section | Description |
|---|---|
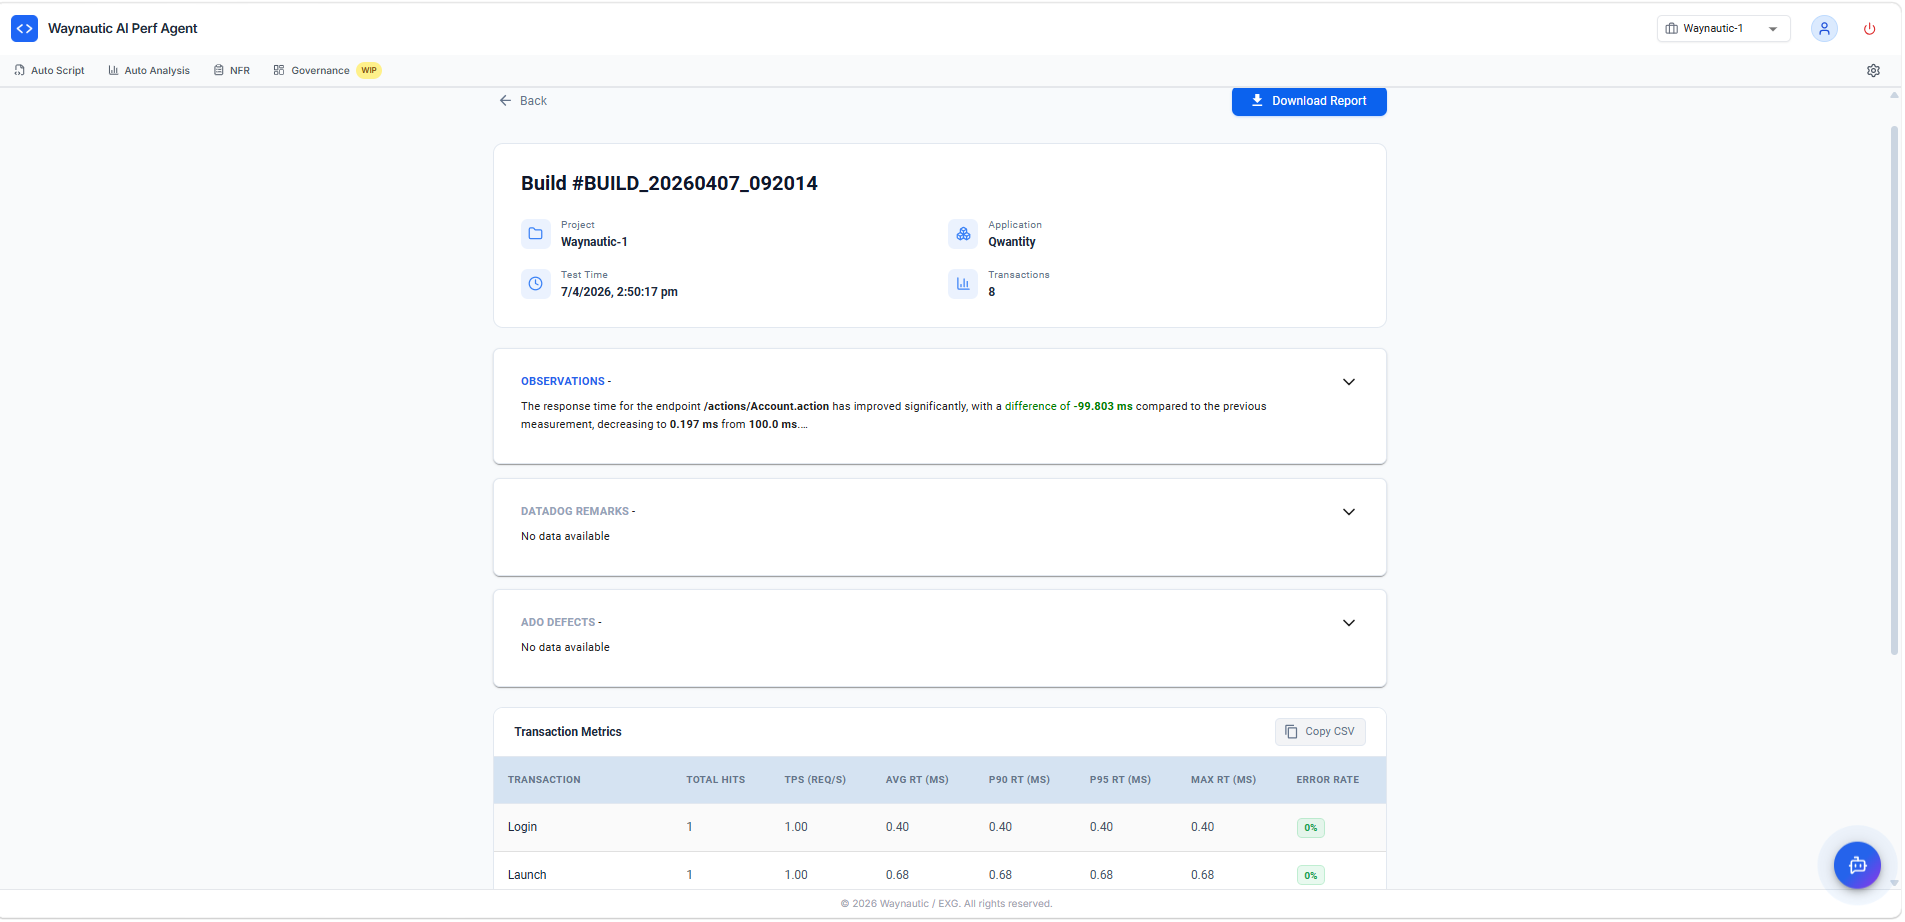
| Build header | Build ID, Project, Application name, Test Time, and total number of Transactions recorded |
| Observations | AI-generated analysis comparing this build's response times to the previous build. Highlights significant improvements or regressions across endpoints |
| Datadog Remarks | Infrastructure and APM observations pulled from Datadog during the test window. Shows "No data available" if Datadog is not configured |
| ADO Defects | Lists any Azure DevOps defects automatically raised from this build. Shows "No data available" if ADO is not connected or no defects were raised |
| Transaction Metrics | A detailed table of per-transaction performance data |
Transaction Metrics Table
The Transaction Metrics table provides the following columns for each recorded transaction:
| Column | Description |
|---|---|
| Transaction | Name of the transaction (e.g., Login, Launch) |
| Total Hits | Total number of requests recorded for this transaction |
| TPS (Req/s) | Transactions per second — the throughput achieved during the test |
| Avg RT (ms) | Average response time in milliseconds |
| P90 RT (ms) | 90th percentile response time — 90% of requests completed within this time |
| P95 RT (ms) | 95th percentile response time |
| Max RT (ms) | The slowest response time recorded for this transaction |
| Error Rate | Percentage of requests that returned an error response |
Click Copy CSV to copy the transaction metrics data to your clipboard for use in external reports or spreadsheets.
Downloading the Report
Click Download Report (top right of the build page) to download the full build report as a file. Share this with stakeholders who were not included in the automated email distribution.
What to Do Next
Once you have reviewed build results:
- Compare against your NFR thresholds — Use the SLAs defined in the NFR Strategy Hub as the benchmark for evaluating whether transactions are meeting their targets.
- Use the AI Chatbot — The built-in chatbot on the build report screen has full context of the results and can answer questions about specific observations or transactions.
- Re-run after fixes — After addressing any regressions identified in Observations, trigger a new run via RUN NOW and compare the new build against the previous one.