AI Chatbot
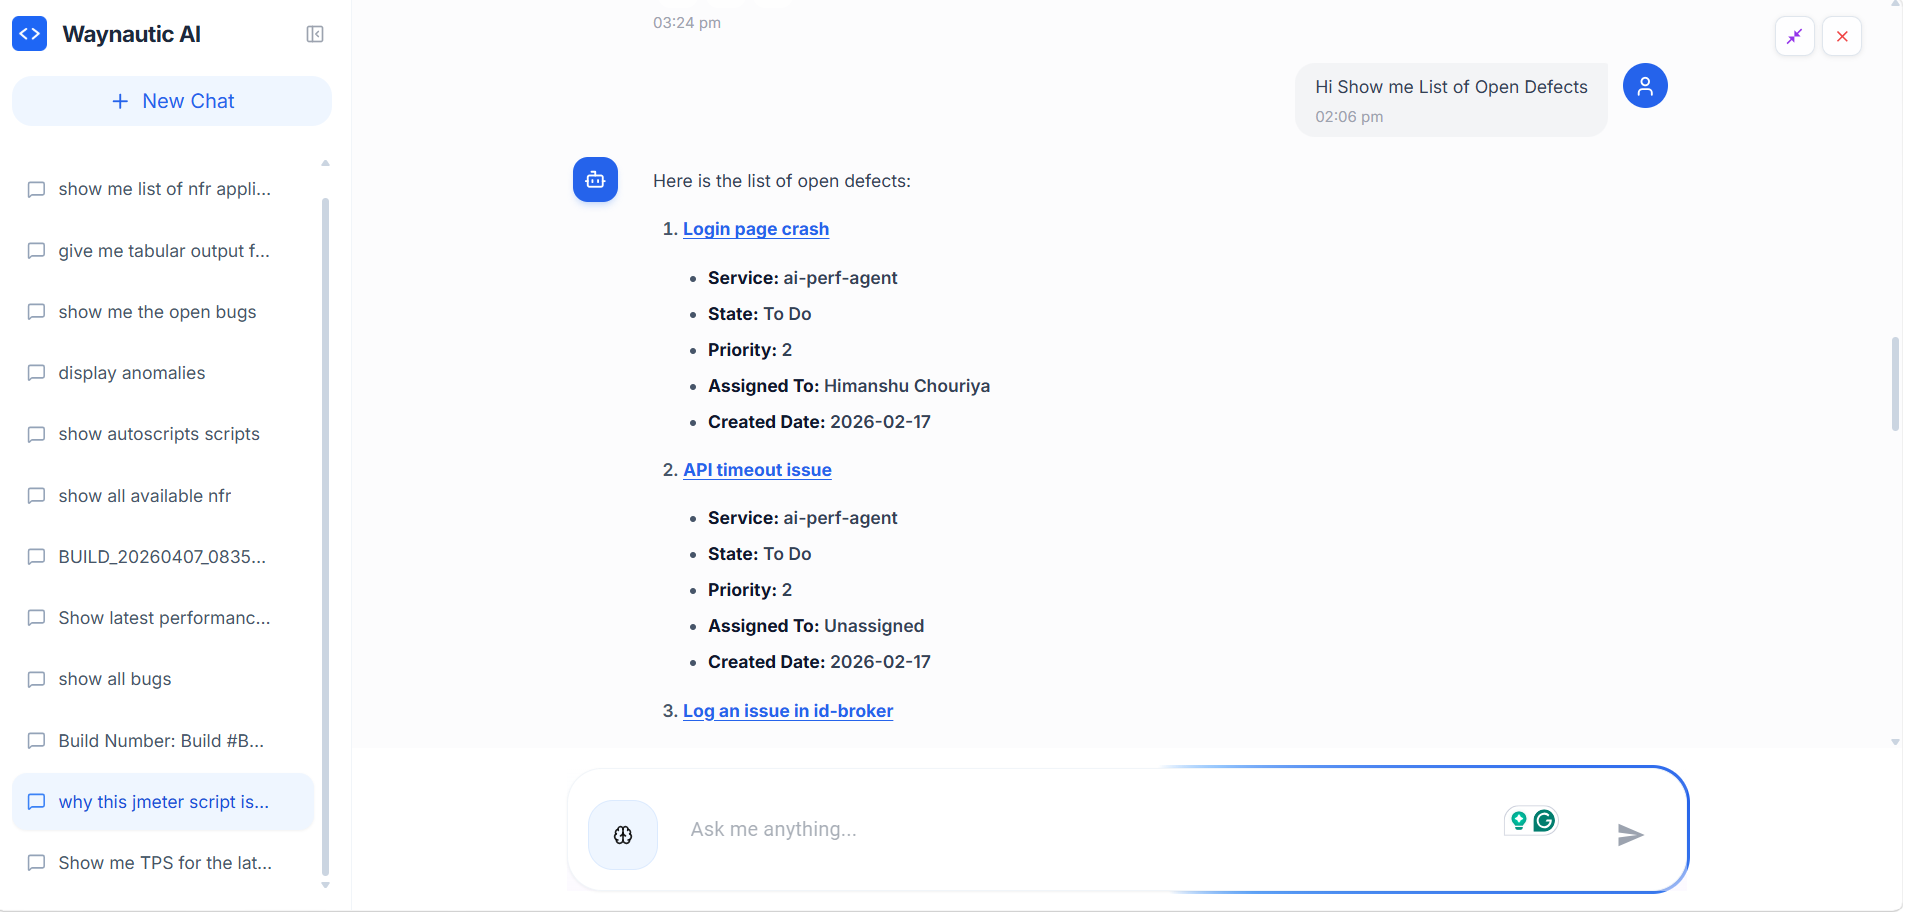
Every screen in Perf Agent includes a built-in AI chatbot, accessible via the chat icon in the bottom-right corner of the interface. It has full context of the platform — your builds, scripts, NFR strategies, bugs, and integrations — and can answer questions, surface insights, and help you navigate results without leaving your current screen.
Rather than manually digging through dashboards, you can ask the chatbot in plain English and get structured, data-driven answers instantly.
Opening the Chatbot
Click the chat icon in the bottom-right corner of any screen in Perf Agent. The chatbot panel slides open as an overlay — it does not navigate you away from your current page.
Each session starts fresh. Use New Chat in the left panel to start a new conversation. Previous sessions are listed under Recent Sessions and can be reopened to review past queries and responses.
Selecting an AI Model
The chatbot icon in the input bar lets you switch the underlying AI model before sending a query.
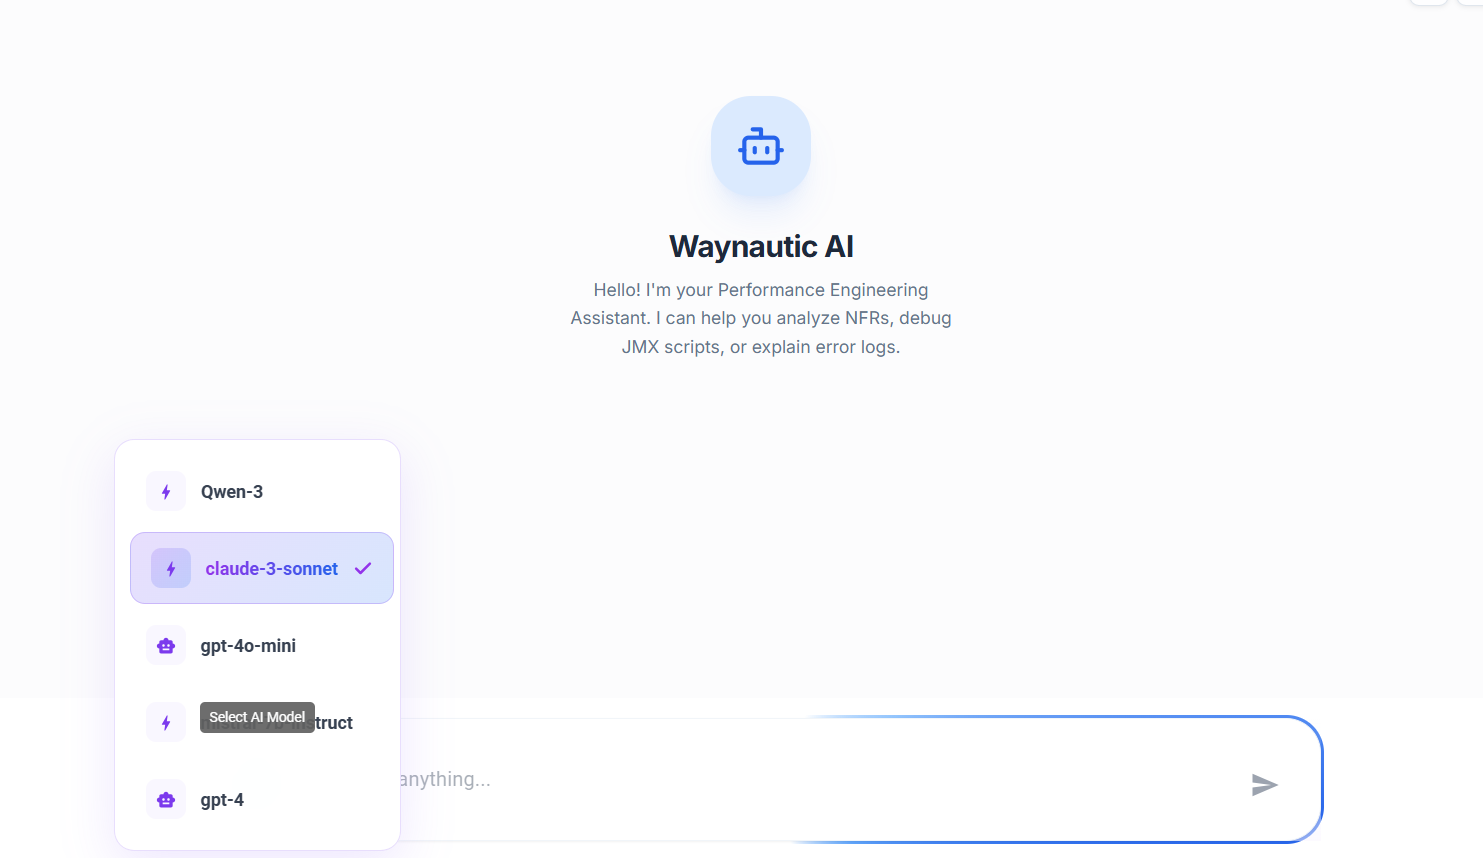
Click the model selector icon (⚙️) next to the input field to see the list of available models. The currently active model is shown with a checkmark. Select any model from the list to switch — your next message will be processed by the selected model.
Available models are configured by your administrator under Settings → AI Settings. See the AI Settings section below for details.
Different models may produce different levels of detail or reasoning depth. If a response feels too brief or lacks context, try switching to a more capable model and re-asking the question.
What the Chatbot Can Answer
The chatbot has access to all data within your Perf Agent workspace. Below are the main categories of questions it can handle.
Performance Metrics
Query response times, TPS (Transactions Per Second), latency, and error rates — for specific services, builds, or endpoints.
Example queries:
Show me the average response time for catalogue-serviceWhat is the 95th percentile response time?Which service has the highest TPS?Show endpoints with response time greater than 1000msShow average latency for id-broker service
Latest Build
Ask about the most recent test execution without needing to know the build number.
Example queries:
Show me the latest build performanceWhat is the status of the latest build?Show error count in the latest buildWhat are the latest build observations?How is the latest build performing?
Specific Build Analysis
Reference any build by its ID or number to drill into its metrics, errors, observations, and defects.
Example queries:
Show me BUILD_20260203_120447What was the performance of build-40?Show observations for build-39What were the Datadog remarks for build-40?Display ADO defects for build-39Compare build-40 with build-39
Trend Analysis
Analyse how performance has changed over time — across builds, services, or specific metrics.
Example queries:
Show TPS trend over last 5 buildsDisplay response time trend over last 10 buildsWhat is the error trend over time?Show performance trend for catalogue-serviceDisplay performance degradation over builds
Service and Endpoint Comparison
Compare performance across multiple services or endpoints side by side.
Example queries:
Compare performance of catalogue-service and workspace-serviceWhich service has the highest response time?Show top 5 services by TPSWhich endpoint has the most errors?Show top 10 slowest endpointsWhich services are within SLA?
Error Analysis
Investigate error rates, error spikes, and failing endpoints across builds and services.
Example queries:
Show error rate for catalogue-serviceWhat is the error percentage in latest build?Show endpoints with error rate greater than 5%Show error trend over last 10 buildsWhich builds had the most errors?Which endpoints are failing?
Build Observations and Defects
Surface observations, Datadog remarks, and ADO defects logged against specific builds.
Example queries:
Show observations for latest buildWhat were the Datadog remarks for build-40?Show all builds with ADO defectsList all builds that have defectsWhich builds have Datadog alerts?
Transaction Analysis
Query individual transaction performance — response times, TPS, error rates, and comparisons across builds.
Example queries:
Show all transactionsWhich transaction has the highest error rate?Display top 5 slowest transactionsWhat is the TPS of login transaction?Which transactions degraded?
Execution Status
Check the status of running, queued, or completed test executions.
Example queries:
Show all failed executionsWhich executions are currently running?What is the status of execution-123?How long did the last execution take?Show execution duration for build-40
Script Management
Query the status and details of scripts generated by Auto Script.
Example queries:
Show me the latest scriptList all completed scriptsShow scripts for MyAppWhich scripts failed?What is the status of script generation?
Bug Analysis
Retrieve open bugs, bug statistics, and bug details from your connected issue tracker.
Example queries:
Show me all open bugsDisplay bugs for Bill Management serviceList high priority bugsHow many critical bugs are open?Show bug count by priorityWhich service has the most bugs?
SLA Compliance
Check whether builds are meeting the SLA thresholds defined in your NFR strategies.
Example queries:
Show builds meeting SLA requirementsWhich builds violated SLA?Display SLA compliance percentageShow response time SLA violationsWhich services are within SLA?
Process and Configuration Questions
Ask how to use any part of Perf Agent — Auto Script requirements, NFR generation steps, integration setup, and more.
Example queries:
What is needed for autoscript?How to generate NFR document?How to configure Azure DevOps?What credentials are needed for BlazeMeter?How to run a performance test?What are the prerequisites for test run?
Tips for Better Results
The chatbot produces more accurate and useful responses when questions are specific and include context.
| Instead of | Try |
|---|---|
Show performance | Show TPS trend for catalogue-service over last 5 builds |
Show errors | Show error trend for workspace-service |
Show response time | Show response time trend over last 10 builds |
Show that build | Show BUILD_20260203_120447 |
Compare builds | Compare build-40 with build-39 |
Use service names — The chatbot understands service identifiers like catalogue-service, id-broker, and workspace-service directly.
Use build numbers or "latest" — Reference builds by their ID (e.g., build-40, BUILD_20260203_120447) or simply say latest build for the most recent execution.
Specify time ranges — Phrases like last 5 builds, last 10 builds, or last 2 weeks narrow the results and produce cleaner trend charts.
Ask follow-up questions — The chatbot retains context within a session. After asking about the latest build, you can follow up with Why did it fail? or Compare it with build-39 without repeating context.
AI Settings
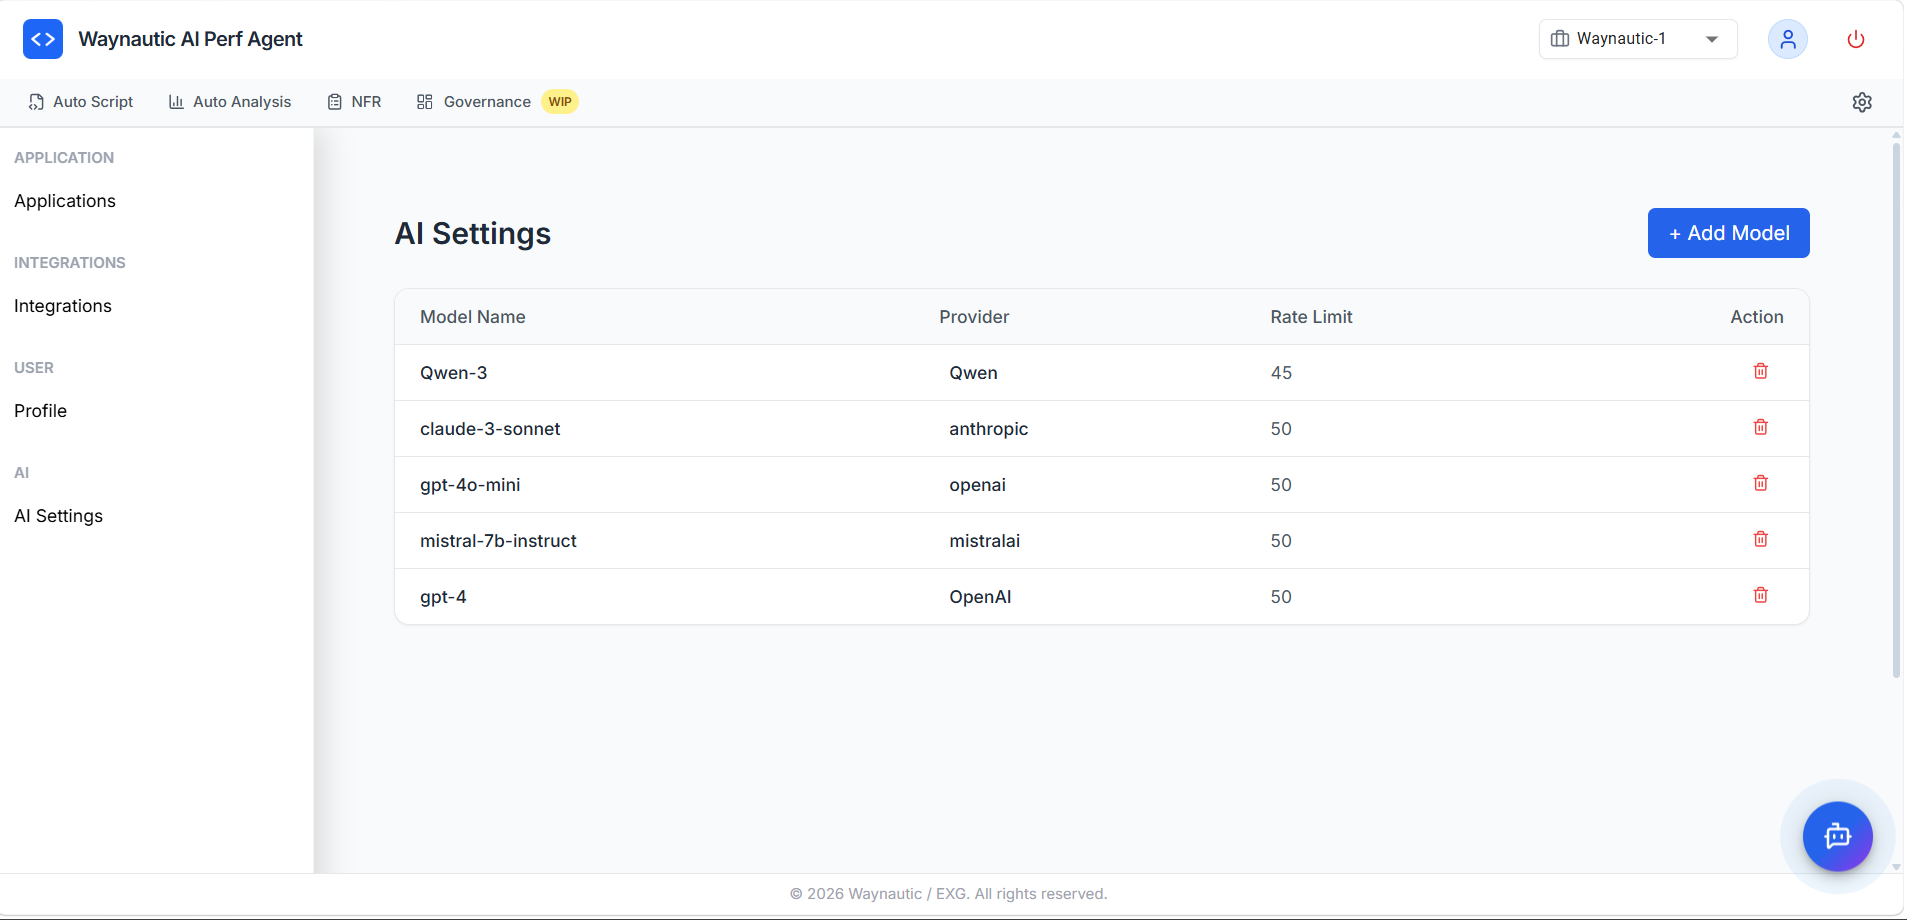
The models available in the chatbot are configured globally under Settings → AI Settings.
Configured Models
The AI Settings table lists all models available to users in the chatbot, with the following columns:
| Column | Description |
|---|---|
| Model Name | The identifier for the model as it appears in the chatbot model selector |
| Provider | The AI provider — anthropic, openai, mistralai, qwen, etc. |
| Rate Limit | Maximum number of requests per minute allowed for this model |
| Action | Delete the model configuration |
Adding a Model
Click + Add Model in the top-right corner of the AI Settings page to register a new model. You will need the model name, provider, API key, and rate limit. Once added, the model becomes immediately available in the chatbot's model selector for all users in the workspace.
Removing a Model
Click the delete icon (🗑️) in the Action column to remove a model. Removing a model makes it unavailable in the chatbot selector — any users who had it selected will fall back to the default model.
AI Settings are administrator-level controls. Contact your Perf Agent administrator if you need a specific model added or if you are experiencing rate limit errors during chatbot queries.